Using the Debug console
The DevTools Debug console allows you to watch an
application’s standard output (stdout),
evaluate expressions for a paused or running
app in debug mode, and analyze inbound and outbound
references for objects.
The Debug console is available from the Inspector, Debugger, and Memory views.
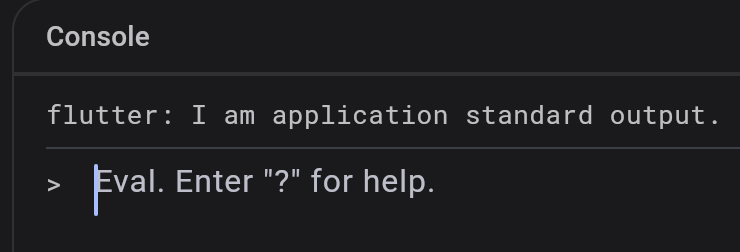
Watch application output
The console shows the application’s standard output (stdout):
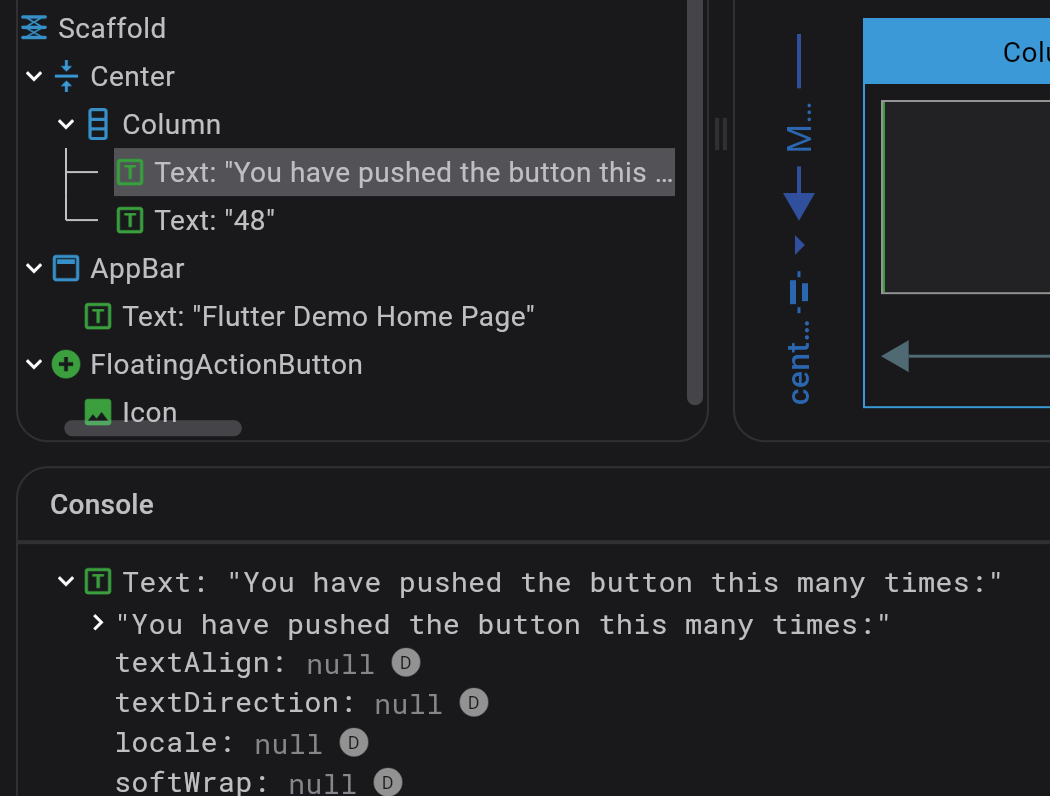
Explore inspected widgets
If you click a widget on the Inspector screen, the variable for this widget displays in the Console:
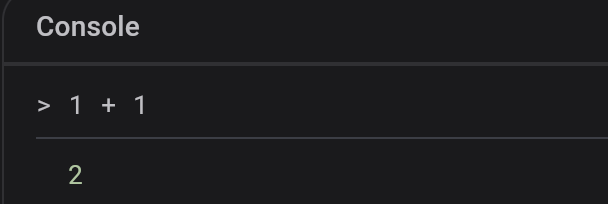
Evaluate expressions
In the console, you can evaluate expressions for a paused or running application, assuming that you are running your app in debug mode:
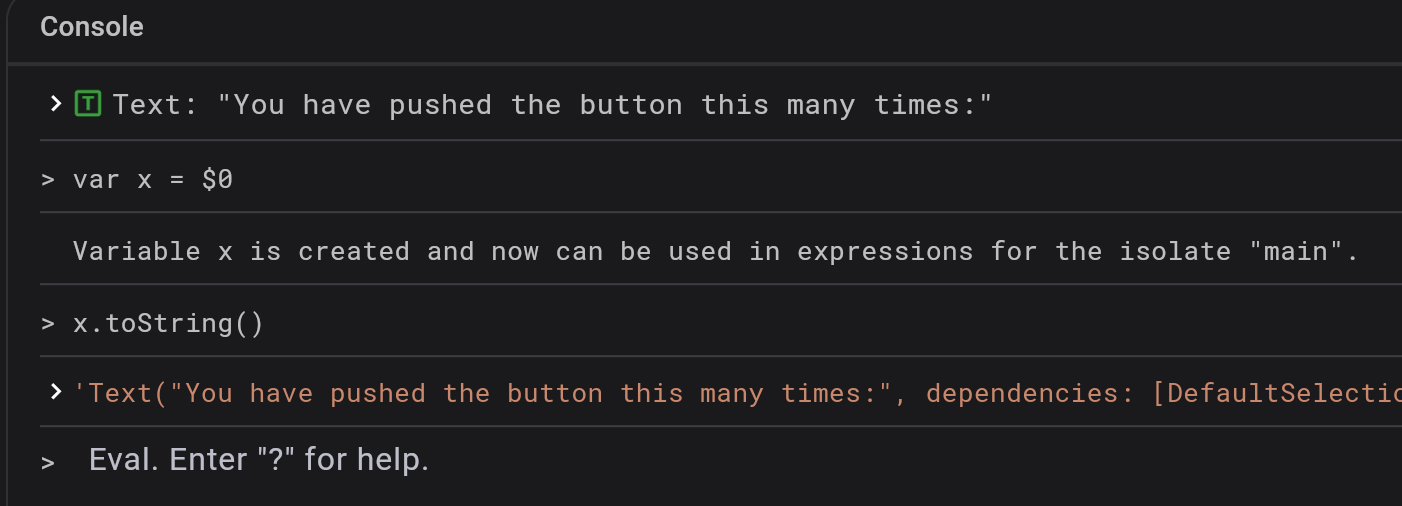
To assign an evaluated object to a variable,
use $0, $1 (through $5) in the form of var x = $0:
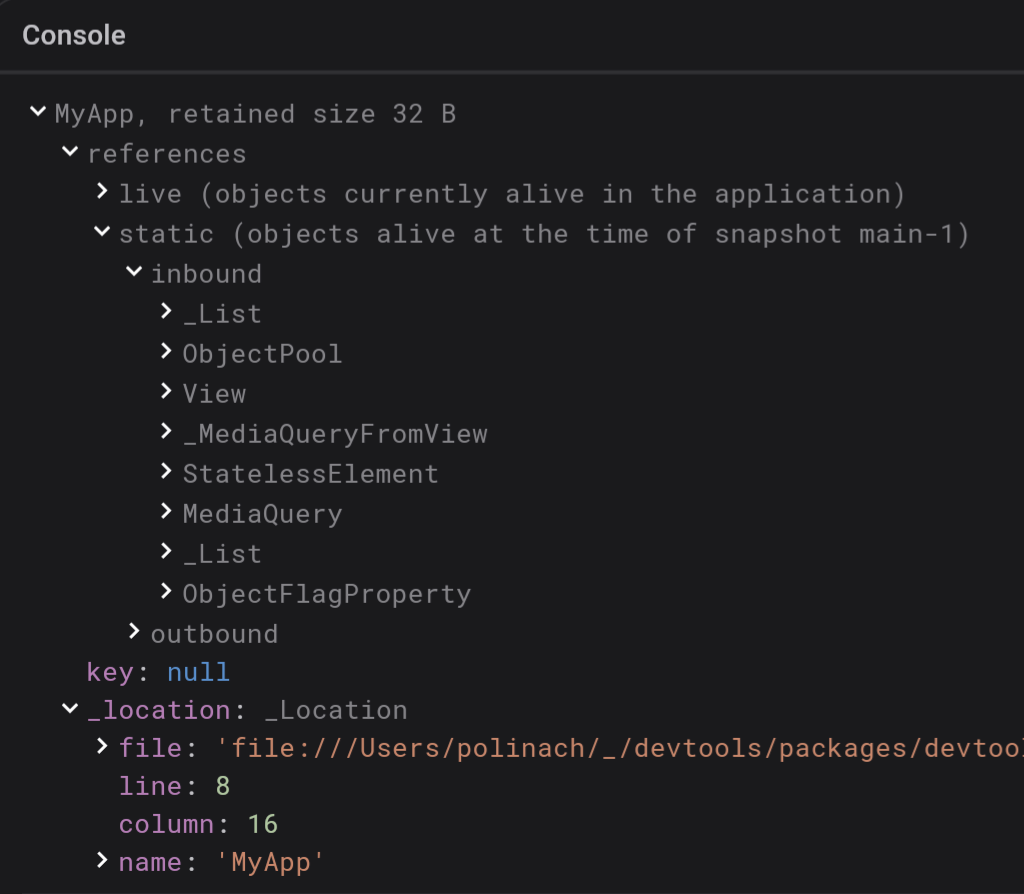
Browse heap snapshot
To drop a variable to the console from a heap snapshot, do the following:
- Navigate to Devtools > Memory > Diff Snapshots.
- Record a memory heap snapshot.
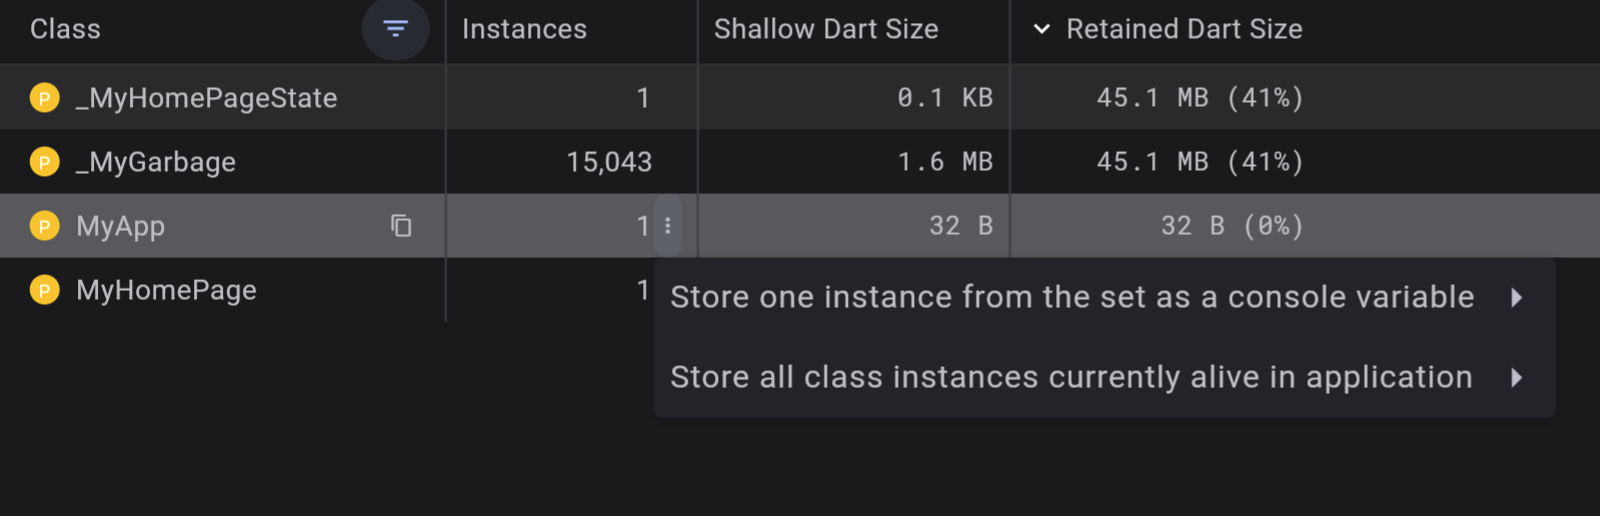
- Click on the context menu
[⋮]to view the number of Instances for the desired Class. - Select whether you want to store a single instance as a console variable, or whether you want to store all currently alive instances in the app.
The Console screen displays both live and static inbound and outbound references, as well as field values: