DevTools 2.18.0 release notes
The 2.18.0 release of the Dart and Flutter DevTools includes the following changes among other general improvements. To learn more about DevTools, check out the DevTools overview.
Inspector updates
- Auto scrolling behavior improved when snapping a widget into focus - #4283
- Fix issue where widget inspector wouldn’t load when connecting to a paused app - #4527
- Improve widget inspector hover cards to show progress while waiting for data - #4488
Performance updates
- Fix issue where scrollbar would go out of sync with the frame content - #4503
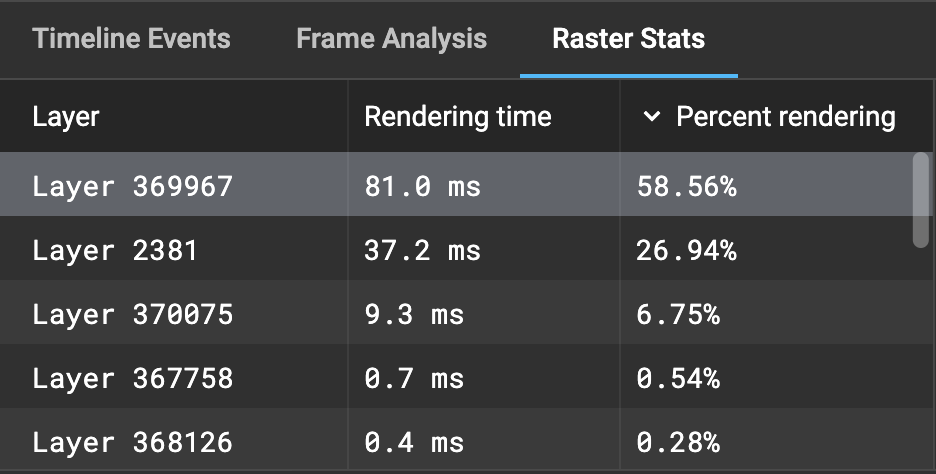
- Add offline support for raster stats - #4491
-
Add ‘Rendering time’ column to Raster Metrics tab - #4474

CPU profiler updates
- Fix crash when an empty frame is filtered - #4502
- Fix bugs in CPU profile trees - #4413
- UI Cleanup - #4404
Memory updates
Debugger updates
- Fix bug for file opener and search - #4525
- Fix the code view’s scrollable area - #4448
- Allow syntax highlighting on nested captures in parser - #4427
Network profiler updates
- When on the Network tab, network recordings now continue working after the app hot restarts - #4438
Logging updates
- Log messages from non-stdout sources are now shown - #4487
Full commit history
To find a complete list of changes since the previous release, check out the diff on GitHub.

