使用内存视图 (Memory view)
The memory view provides insights into details of the application’s memory allocation and tools to detect and debug specific issues.
For information on how to locate DevTools screens in different IDEs, check out the DevTools overview.
To better understand the insights found on this page, the first section explains how Dart manages memory. If you already understand Dart’s memory management, you can skip to the Memory view guide.
Reasons to use the memory view
Use the memory view for preemptive memory optimization or when your application experiences one of the following conditions:
- Crashes when it runs out of memory
- Slows down
- Causes the device to slow down or become unresponsive
- Shuts down because it exceeded the memory limit, enforced by operating system
- Exceeds memory usage limit
- This limit can vary depending on the type of devices your app targets.
- Suspect a memory leak
Basic memory concepts
Dart objects created using a class constructor
(for example, by using MyClass()) live in a
portion of memory called the heap. The memory
in the heap is managed by the Dart VM (virtual machine).
The Dart VM allocates memory for the object at the moment of the object creation,
and releases (or deallocates) the memory when the object
is no longer used (see Dart garbage collection).
Root object, retaining path, and reachability
Root object
Every Dart application creates a root object that references, directly or indirectly, all other objects the application allocates.
Reachability
If, at some moment of the application run, the root object stops referencing an allocated object, the object becomes unreachable, which is a signal for the garbage collector (GC) to deallocate the object’s memory.
Retaining path
The sequence of references from root to an object is called the object’s retaining path, as it retains the object’s memory from the garbage collection. One object can have many retaining paths. Objects with at least one retaining path are called reachable objects.
Example
The following example illustrates the concepts:
class Child{}

class Parent {
  Child? child;
}

Parent parent1 = Parent();

void myFunction() {

  Child? child = Child();

  // The `child` object was allocated in memory.
  // It's now retained from garbage collection
  // by one retaining path (root …-> myFunction -> child).

  Parent? parent2 = Parent()..child = child;
  parent1.child = child;

  // At this point the `child` object has three retaining paths:
  // root …-> myFunction -> child
  // root …-> myFunction -> parent2 -> child
  // root -> parent1 -> child

  child = null;
  parent1.child = null;
  parent2 = null;

  // At this point, the `child` instance is unreachable
  // and will eventually be garbage collected.

  …
}
Shallow size vs retained size
Shallow size includes only the size of the object and its references, while retained size also includes the size of the retained objects.
The retained size of the root object includes all reachable Dart objects.
In the following example, the size of myHugeInstance
isn’t part of the parent’s or child’s shallow sizes,
but is part of their retained sizes:
class Child{
  /// The instance is part of both [parent] and [parent.child]
  /// retained sizes.
  final myHugeInstance = MyHugeInstance();
}

class Parent {
  Child? child;
}

Parent parent = Parent()..child = Child();
In DevTools calculations, if an object has more than one retaining path, its size is assigned as retained only to the members of the shortest retaining path.
In this example the object x has two retaining paths:
root -> a -> b -> c -> x
root -> d -> e -> x (shortest retaining path to `x`)
Only members of the shortest path (d and e) will include
x into their retaining size.
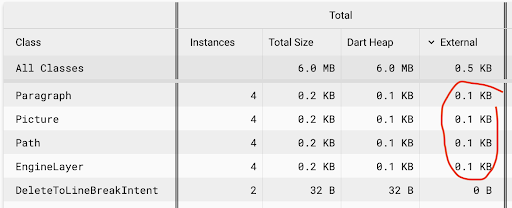
Dart size vs external (native) size
Some parts of an object (for example, graphics) might be stored outside of Dart heap, in native device memory.
You can observe an object’s Dart heap, external, and total memory allocation breakdown on the Profile tab:
Memory leaks happen in Dart?
Garbage collector cannot prevent all types of memory leaks, and developers still need to watch objects to have leak-free lifecycle.
Why garbage collector cannot prevent all leaks?
While the garbage collector takes care of all unreachable objects, it’s the responsibility of the application to ensure that unneeded objects are no longer reachable (referenced from the root).
So, if non needed objects are left referenced
(in a global or static variable,
or as a field of a long-living object),
the garbage collector can’t recognize them,
the memory allocation grows progressively,
and the app eventually crashes with an out-of-memory error.
Why closures require extra attention
One hard-to-catch leak pattern relates to using closures.
In the following code, a reference to the
designed-to-be short-living myHugeObject is implicitly
stored in the closure context and passed to setHandler.
As a result, myHugeObject won’t be garbage collected
as long as handler is reachable.
  final handler = () => print(myHugeObject.name);
  setHandler(handler);
Why BuildContext requires extra attention
An example of a large, short-living object that
might squeeze into a long-living area and thus cause leaks,
is the context parameter passed to Flutter’s
build method.
The following code is leak prone,
as useHandler might store the handler
in a long-living area:
// BAD: DO NOT DO THIS
// This code is leak prone:
@override
Widget build(BuildContext context) {
  final handler = () => apply(Theme.of(context));
  useHandler(handler);
…
How to fix leak prone code?
The following code is not leak prone, because:
- The closure doesn’t use the large and short-living
contextobject. - The
themeobject (used instead) is long-living. It is created once and shared betweenBuildContextinstances.
// GOOD
@override
Widget build(BuildContext context) {
  final theme = Theme.of(context);
  final handler = () => apply(theme);
  useHandler(handler);
…
General rule for BuildContext
In general, use the following rule for a
BuildContext: if the closure doesn’t outlive
the widget, it’s ok to pass the context to the closure.
Stateful widgets require extra attention. They consist of two classes: the widget and the widget state, where the widget is short living, and the state is long living. The build context, owned by the widget, should never be referenced from the state’s fields, as the state won’t be garbage collected together with the widget, and can significantly outlive it.
Memory leak vs memory bloat
In a memory leak, an application progressively uses memory, for example, by repeatedly creating a listener, but not disposing it.
Memory bloat uses more memory than is necessary for optimal performance, for example, by using overly large images or keeping streams open through their lifetime.
Both leaks and bloats, when large,
cause an application to crash with an out-of-memory error.
However, leaks are more likely to cause memory issues,
because even a small leak,
if repeated many times, leads to a crash.
Memory view guide
The DevTools memory view helps you investigate memory allocations (both in the heap and external), memory leaks, memory bloat, and more. The view has the following features:
- Expandable chart
- Get a high-level trace of memory allocation, and view both standard events (like garbage collection) and custom events (like image allocation).
- Profile tab
- See current memory allocation listed by class and memory type (Dart or external/native).
- Diff tab
- Detect and investigate a feature’s memory management issues.
- Trace tab
- Investigate a feature’s memory management for a specified set of classes.
Expandable chart
The expandable chart provides the following features:
Memory anatomy
A timeseries graph visualizes the state of Flutter memory at successive intervals of time. Each data point on the chart corresponds to the timestamp (x-axis) of measured quantities (y-axis) of the heap. For example, usage, capacity, external, garbage collection, and resident set size are captured.
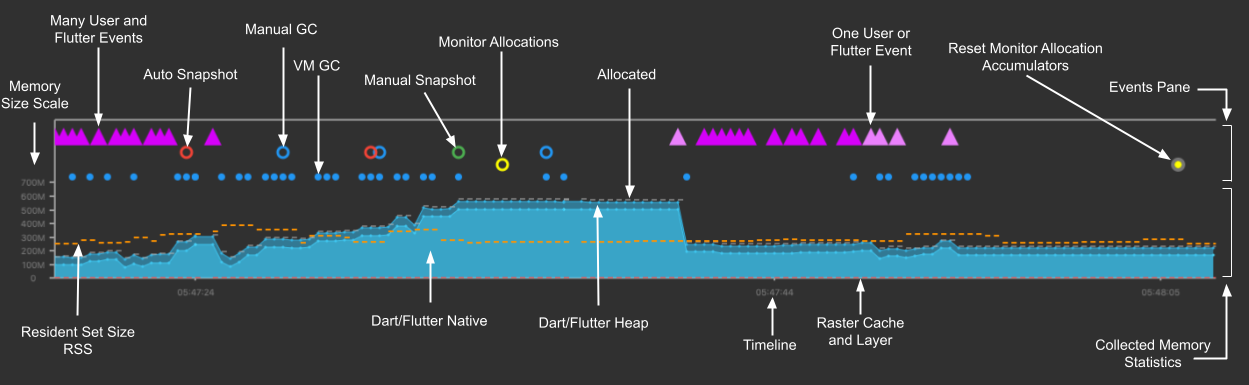
Memory overview chart
The memory overview chart is a timeseries graph of collected memory statistics. It visually presents the state of the Dart or Flutter heap and Dart’s or Flutter’s native memory over time.
The chart’s x-axis is a timeline of events (timeseries). The data plotted in the y-axis all has a timestamp of when the data was collected. In other words, it shows the polled state (capacity, used, external, RSS (resident set size), and GC (garbage collection)) of the memory every 500 ms. This helps provide a live appearance on the state of the memory as the application is running.
Clicking the Legend button displays the collected measurements, symbols, and colors used to display the data.
The Memory Size Scale y-axis automatically adjusts to the range of data collected in the current visible chart range.
The quantities plotted on the y-axis are as follows:
- Dart/Flutter Heap
- Objects (Dart and Flutter objects) in the heap.
- Dart/Flutter Native
- Memory that isn’t in the Dart/Flutter heap but is still part of the total memory footprint. Objects in this memory would be native objects (for example, from reading a file into memory, or a decoded image). The native objects are exposed to the Dart VM from the native OS (such as Android, Linux, Windows, iOS) using a Dart embedder. The embedder creates a Dart wrapper with a finalizer, allowing Dart code to communicate with these native resources. Flutter has an embedder for Android and iOS. For more information, see Command-line and server apps, Dart on the server with Dart Frog, Custom Flutter Engine Embedders, Dart web server deployment with Heroku.
- Timeline
- The timestamps of all collected memory statistics and events at a particular point in time (timestamp).
- Raster Cache
- The size of the Flutter engine’s raster cache layer(s) or picture(s), while performing the final rendering after compositing. For more information, see the Flutter architectural overview and DevTools Performance view.
- Allocated
- The current capacity of the heap is typically slightly larger than the total size of all heap objects.
- RSS - Resident Set Size
- The resident set size displays the amount of memory for a process. It doesn’t include memory that is swapped out. It includes memory from shared libraries that are loaded, as well as all stack and heap memory. For more information, see Dart VM internals.
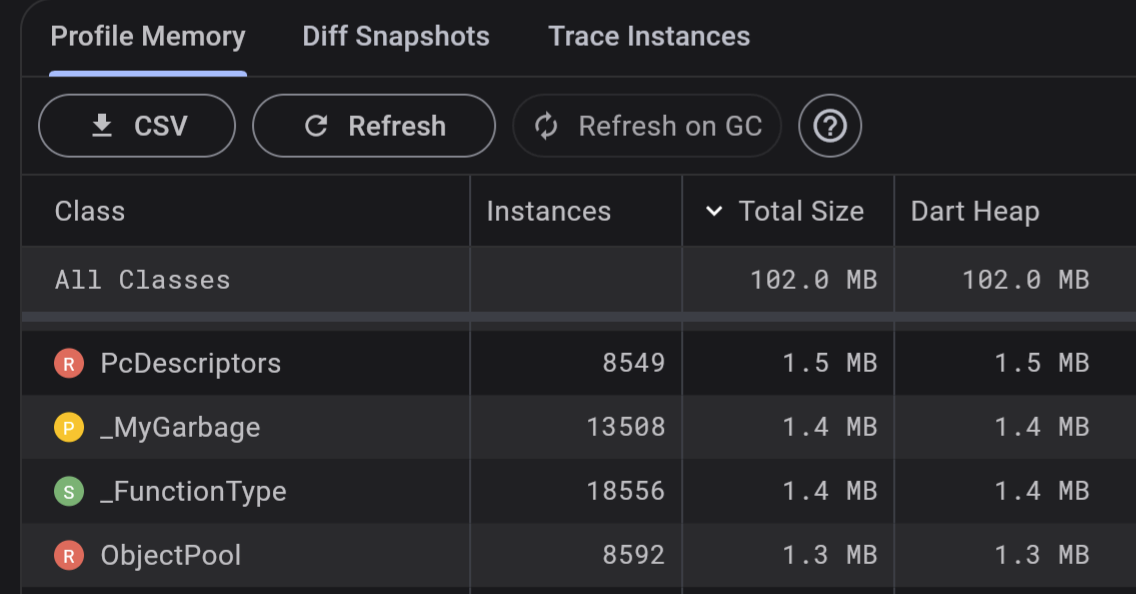
Profile tab
Use the Profile tab to see current memory allocation by class and memory type. For a deeper analysis in Google Sheets or other tools, download the data in CSV format. Toggle Refresh on GC, to see allocation in real time.
Diff tab
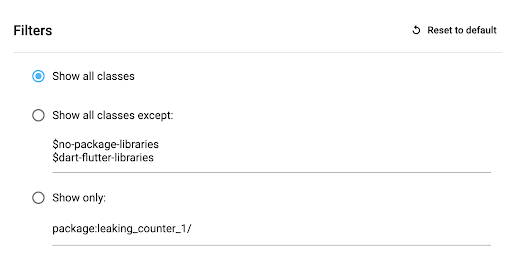
Use the Diff tab to investigate a feature’s memory management. Follow the guidance on the tab to take snapshots before and after interaction with the application, and diff the snapshots:
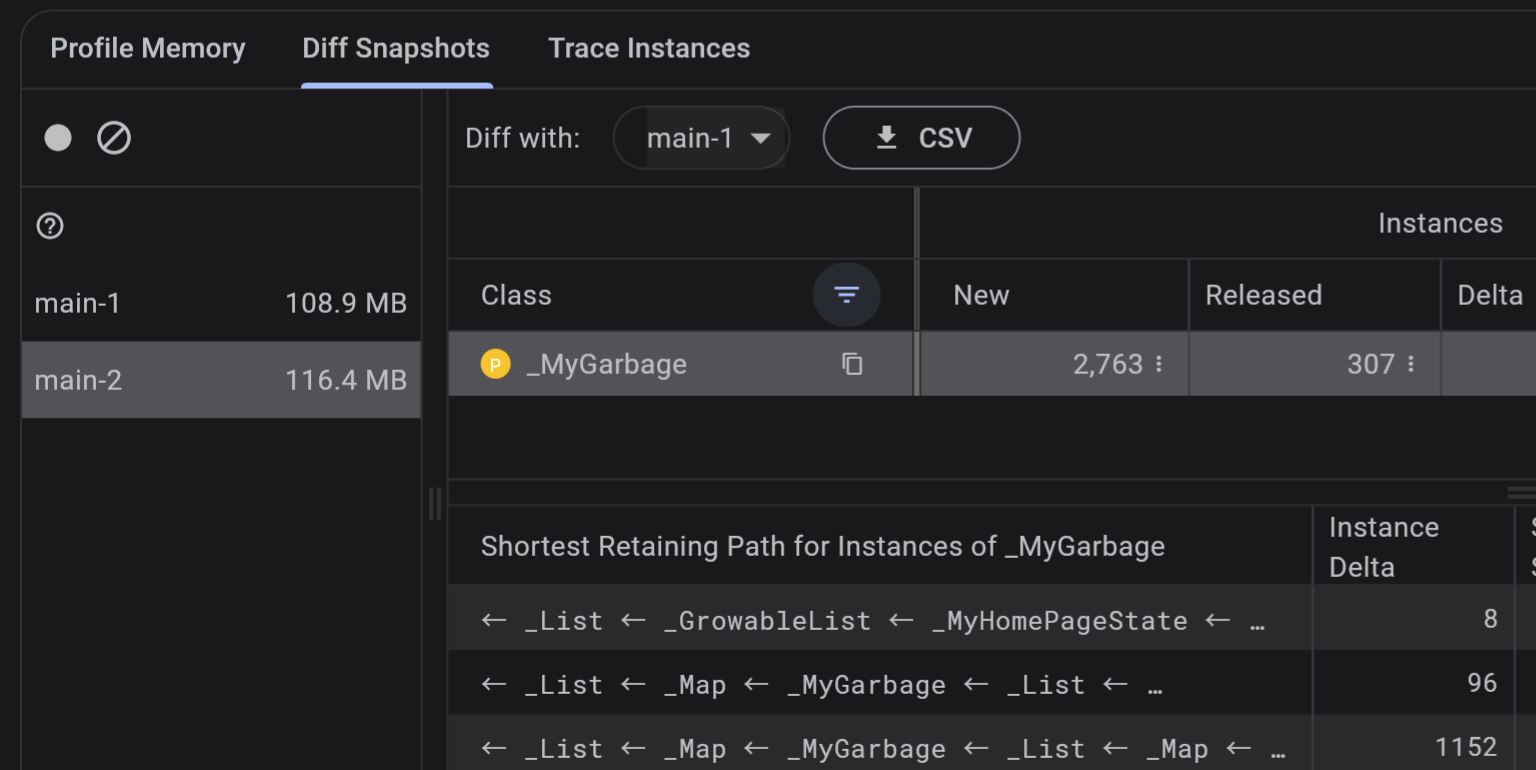
Tap the Filter classes and packages button, to narrow the data:
For a deeper analysis in Google Sheets or other tools, download the data in CSV format.
Trace tab
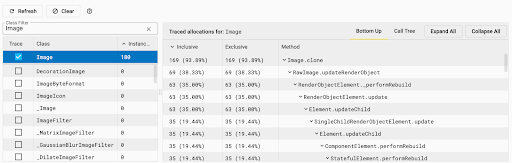
Use the Trace tab to investigate what methods allocate memory for a set of classes during feature execution:
- Select classes to trace
- Interact with your app to trigger the code you are interested in
- Tap Refresh
- Select a traced class
- Review the collected data
Bottom up vs call tree view
Switch between bottom-up and call tree views depending on specifics of your tasks.
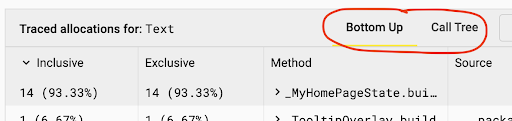
The call tree view shows the method allocations for each instance. The view is a top-down representation of the call stack, meaning that a method can be expanded to show its callees.
The bottom-up view shows the list of different call stacks that have allocated the instances.
Other resources
To learn how to monitor an app’s memory usage and detect memory leaks using DevTools, check out a guided Memory View tutorial.