使用性能视图 (Performance view)
基础的性能概念
性能视图是什么?
性能视图提供了应用活动的时间线以及性能信息。它由三个部分组成,且每个部分的粒度都更加细。
-
Flutter 火焰图(仅支持 Flutter 应用)
-
时间线事件图
-
CPU 监控
The performance view also supports importing and exporting of data snapshots. For more information, check out the Import and export section.
What is a frame in Flutter?
Flutter is designed to render its UI at 60 frames per second (fps), or 120 fps on devices capable of 120Hz updates. Each render is called a frame. This means that, approximately every 16ms, the UI updates to reflect animations or other changes to the UI. A frame that takes longer than 16ms to render causes jank (jerky motion) on the display device.
Flutter frames chart
This chart contains Flutter frame information for your application. Each bar set in the chart represents a single Flutter frame. The bars are color-coded to highlight the different portions of work that occur when rendering a Flutter frame: work from the UI thread and work from the raster thread (previously known as the GPU thread).
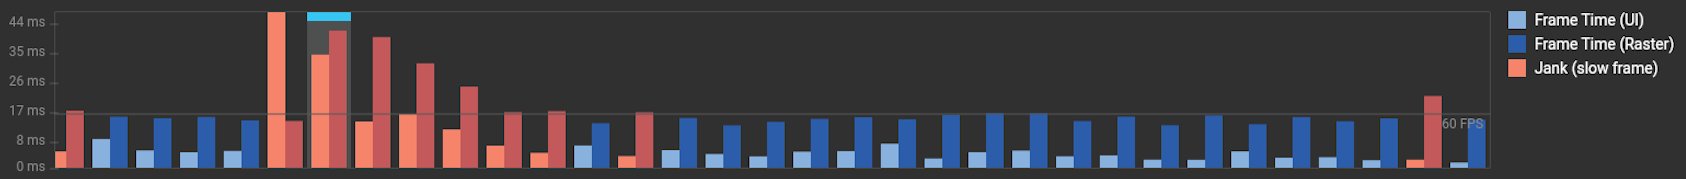
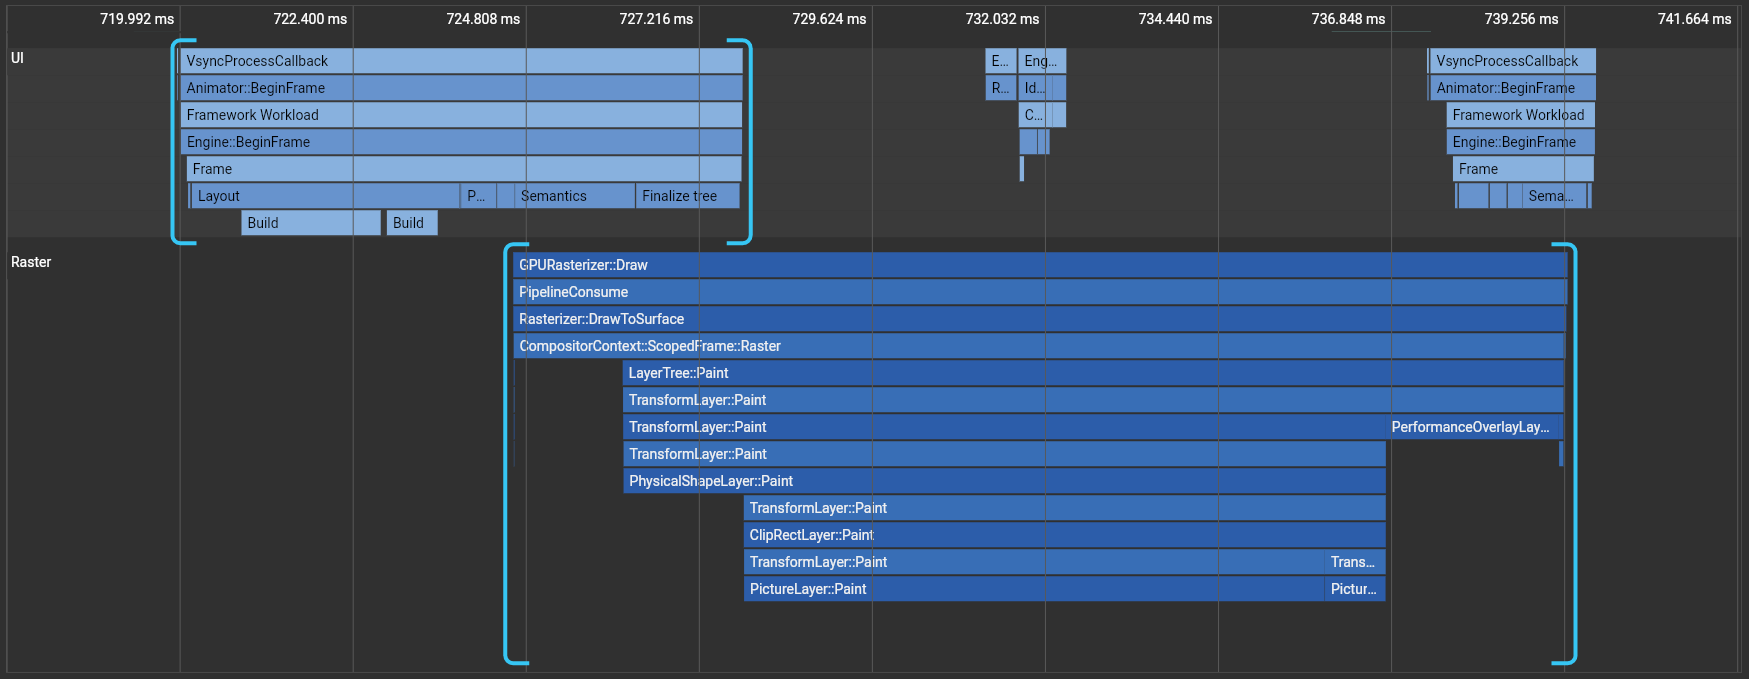
Selecting a bar from this chart centers the flame chart below on the timeline events corresponding to the selected Flutter frame. The events are highlighted with blue brackets.
UI
UI 线程执行 Dart VM 中的 Dart 代码。它包括你的应用程序和 Flutter 框架的所有代码。当你创建或打开一个页面, UI 线程会创建一个图层树和一个轻量级的与设备无关的绘制指令集,并把图层树交给设备的 raster(栅格)线程进行渲染。 不要 阻塞这个线程。
栅格线程
栅格化线程(也就是我们之前知道的 GPU 线程)执行 Flutter 引擎中图形相关的代码。这个线程通过与 GPU (图形处理单元) 通信,获取图形树并显示它。你不能直接访问 Raster 线程或它的数据,但如果这个线程较慢,那它肯定是由你的 Dart 代码引起的。图形化库 Skia 运行在这个线程上,有时候也称它为光栅线程。
有时候一个页面的图形层树比较容易构建但 raster 线程的渲染却比较昂贵。在这种情形下,你需要找出导致渲染变慢的代码。为 GPU 设定特定多种类型的 workload 是相当困难的。在一些特定的情形下,多个对象的透明度重叠、剪切或阴影,有可能会导致不必要的 saveLayer() 的调用。
更多详细信息,请查看文档 定位 GPU 图表中的问题。
卡顿 (Jank)
帧渲染图表使用红色图层显示帧延时。如果一帧的渲染时间超过 16ms,则会被认为此帧是延时的,为了达到帧渲染频率到 60 FPS (每秒帧数),每一帧的渲染时间必须等于或少于 16 ms。如果没有达到这个目标,你会发现 UI 不流畅或丢帧。
更多关于性能分析信息,请查看文档:Flutter 性能分析。
着色器渲染
着色器渲染
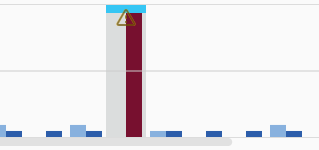
在 Flutter 应用中,着色器会在初次使用时发生渲染。参与了着色器编译的构建帧已标记为深红色:
想要了解更多关于如何减少着色器缓存卡顿的内容,阅读 在移动端减少着色器编译卡顿。
时间线事件表
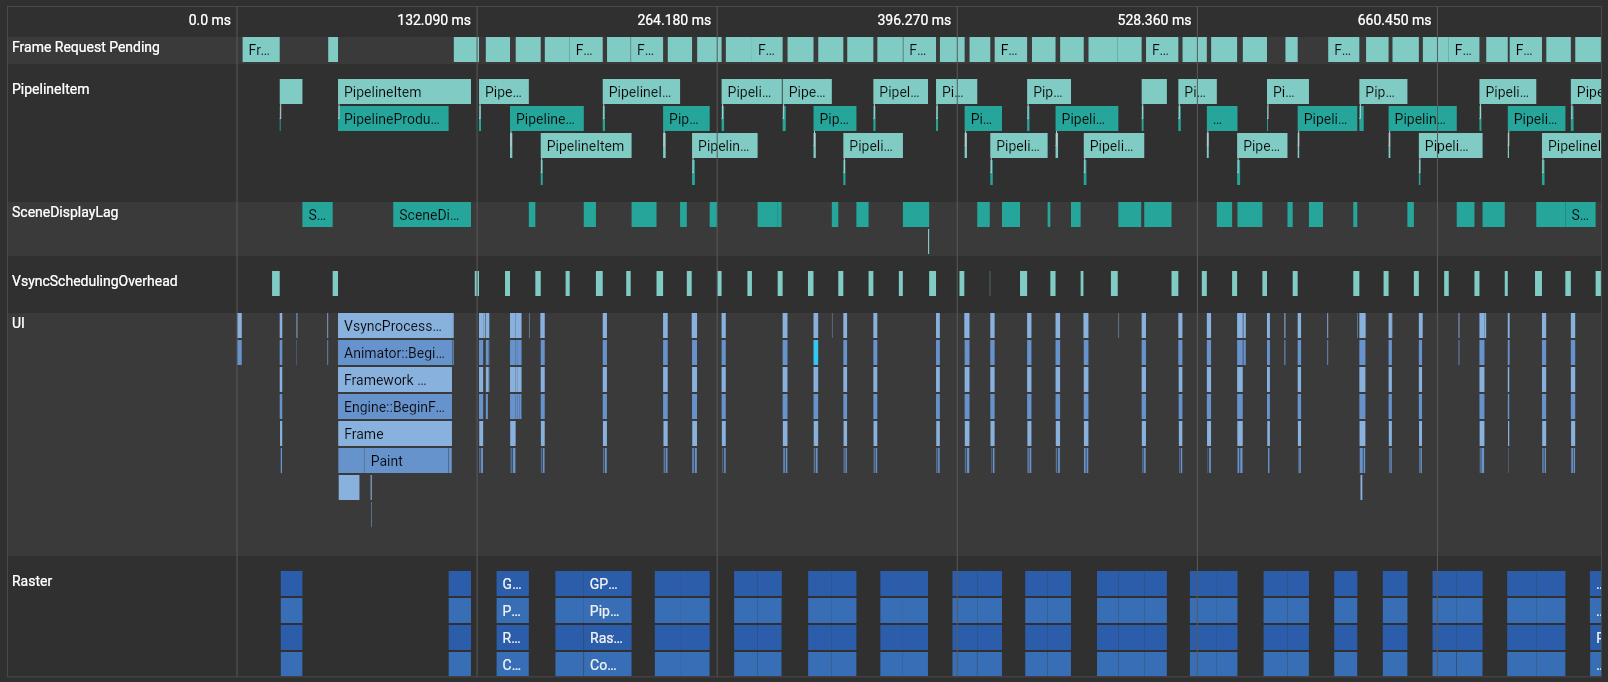
The timeline events chart shows all event tracing from your application.
The Flutter framework emits timeline events as it works to build frames,
draw scenes, and track other activity such as HTTP traffic.
These events show up here in the Timeline.
You can also send your own Timeline events using the dart:developer
Timeline
and TimelineTask
APIs.
The flame chart supports zooming and panning:
- To zoom, scroll up and down with the mouse wheel / trackpad
- To pan horizontally, either click and drag the chart or scroll horizontally with the mouse wheel / trackpad
- To pan vertically, either click and drag the chart or use alt + scroll
- The WASD keys also work for controlling zoom and horizontal scroll position
You can click an event to view CPU profiling information in the CPU profiler below, described in the next section.
增强的追踪选项
想要在时间线事件图表里查看更详细的追踪内容,请使用增强的追踪下拉控件里的选项:
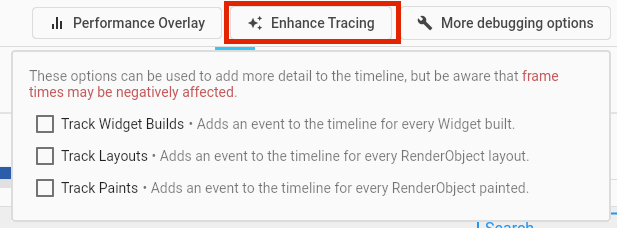
你可以重复操作你想要追踪的行为来查看新的时间线事件,操作后可以在时间线中选择一个构建帧进行查看。
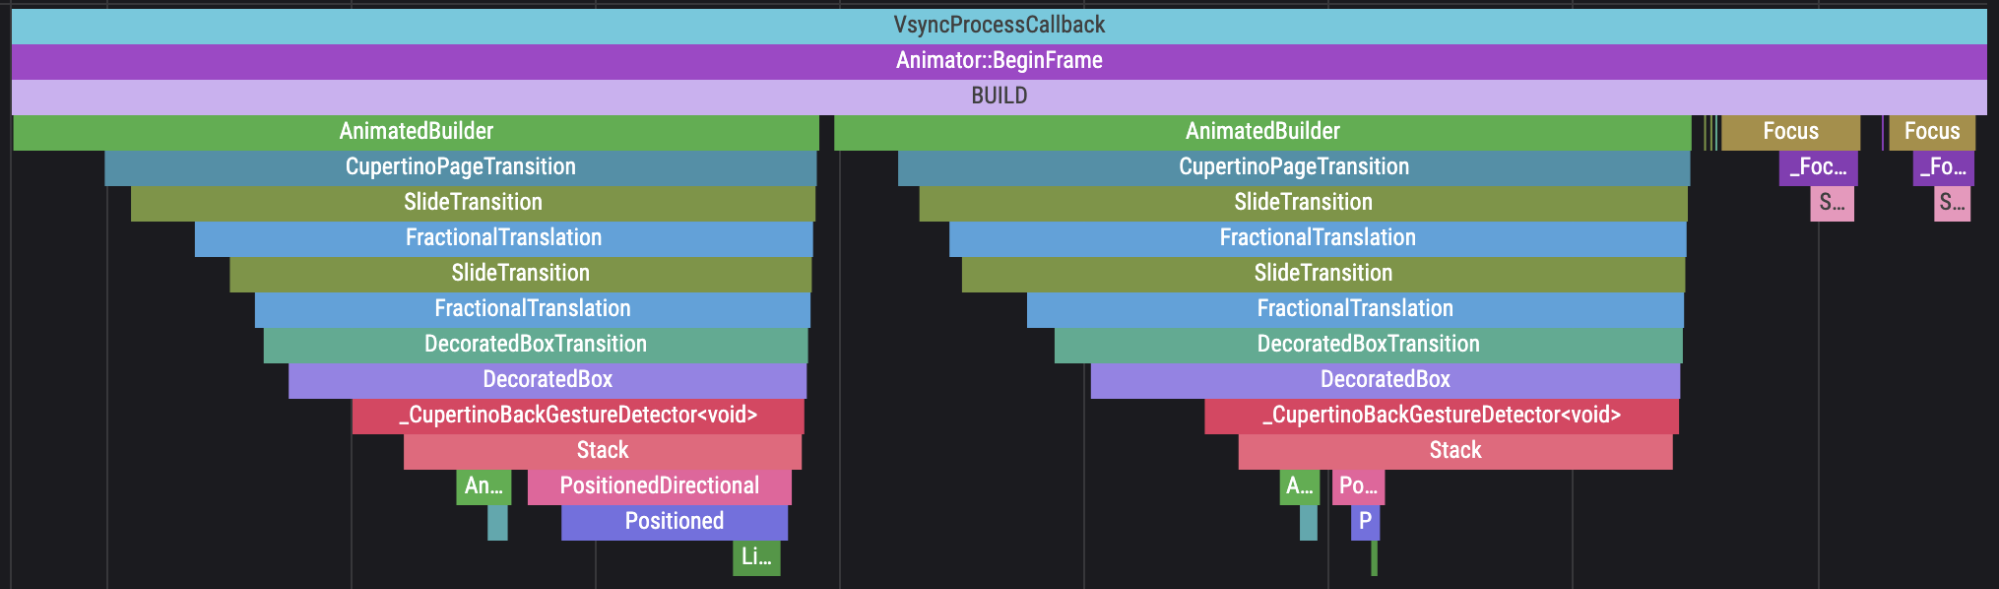
追踪 widget 的构建
想要在时间线中查看 build() 方法的事件,启用 Track Widget Builds 选项,时间线中将出现 widget 对应名称的事件。
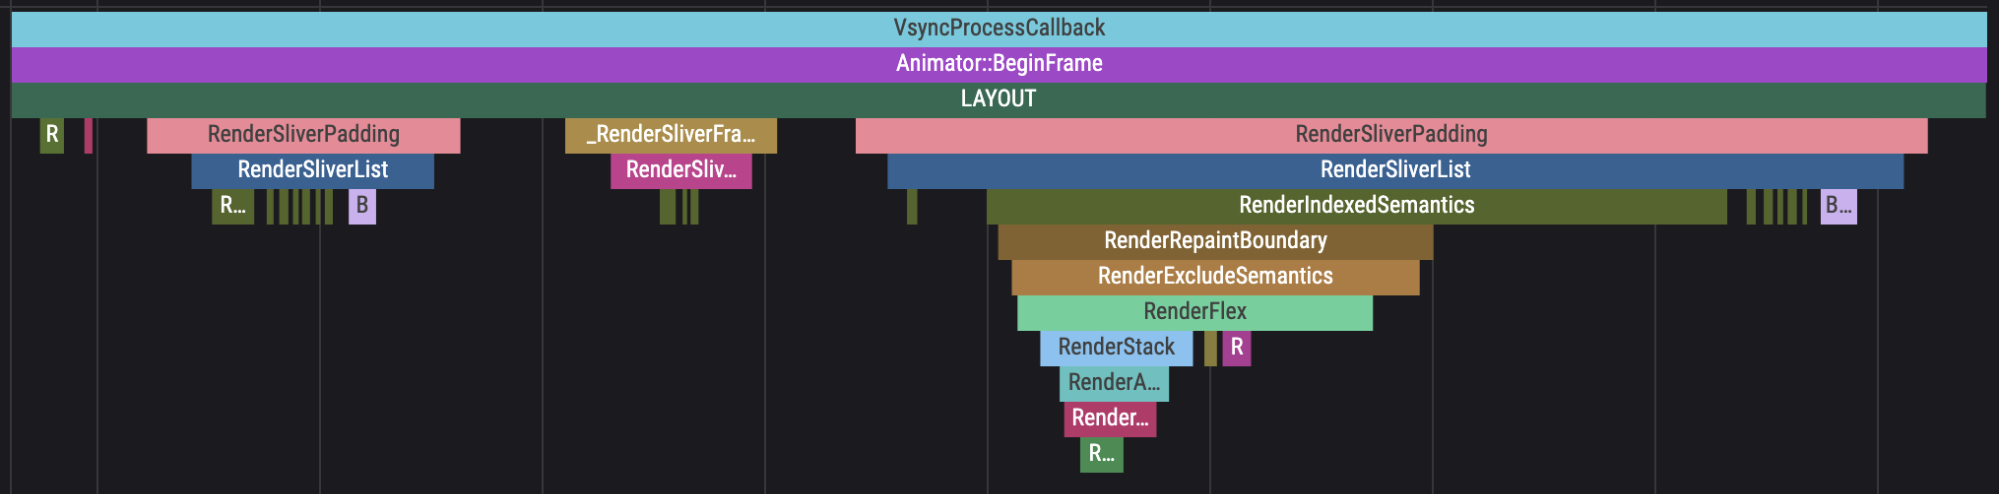
追踪布局
想要在时间线中查看 RenderObject 布局构建的事件,启用 Track Layouts 选项:
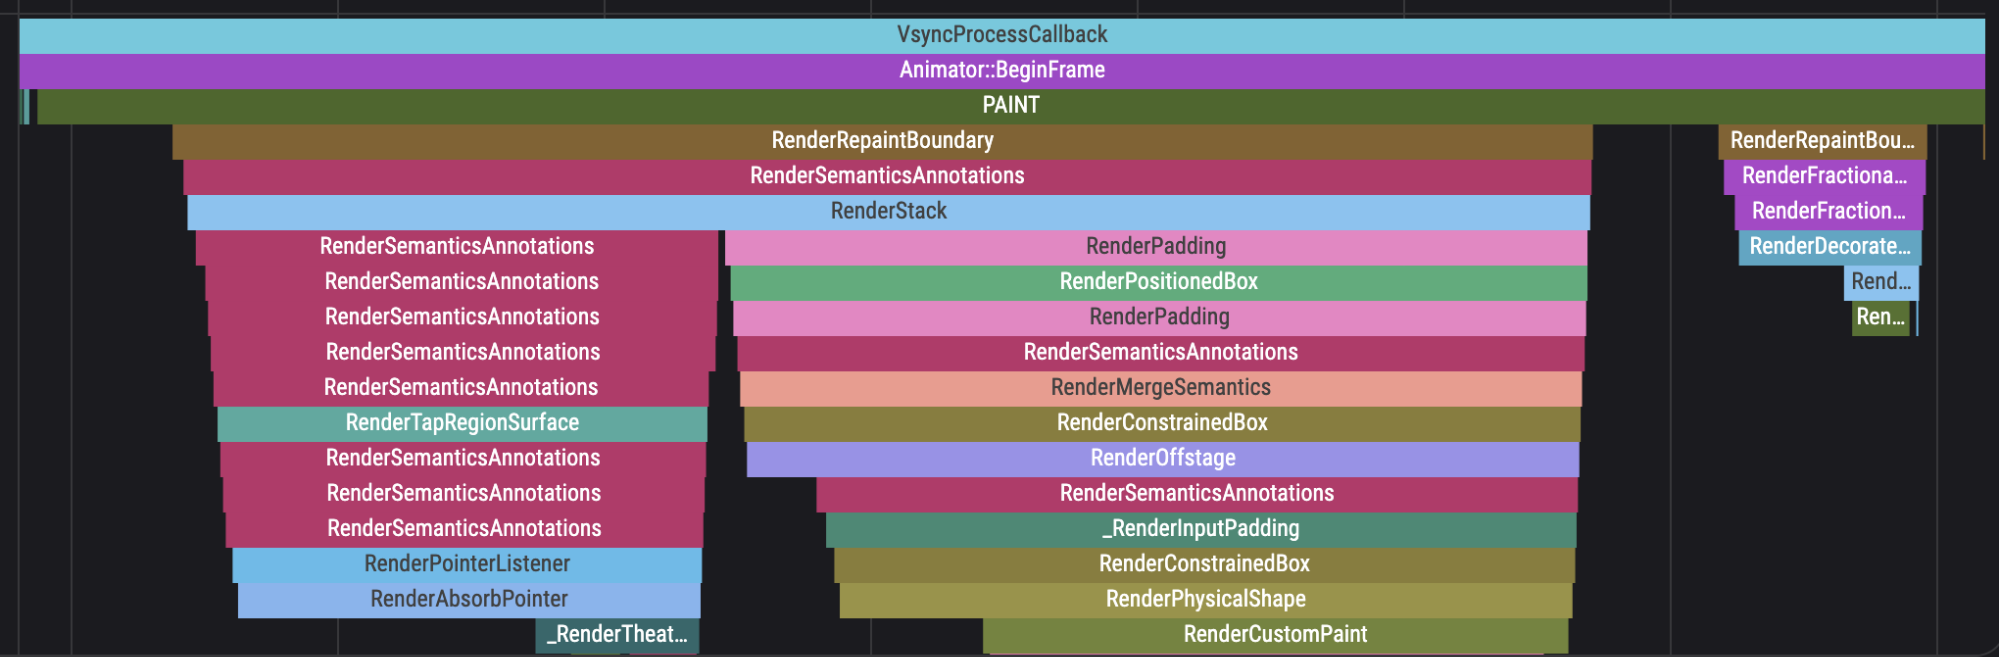
追踪绘制
想要在时间线中查看 RenderObject 的绘制事件,启用 Track Paints 选项:
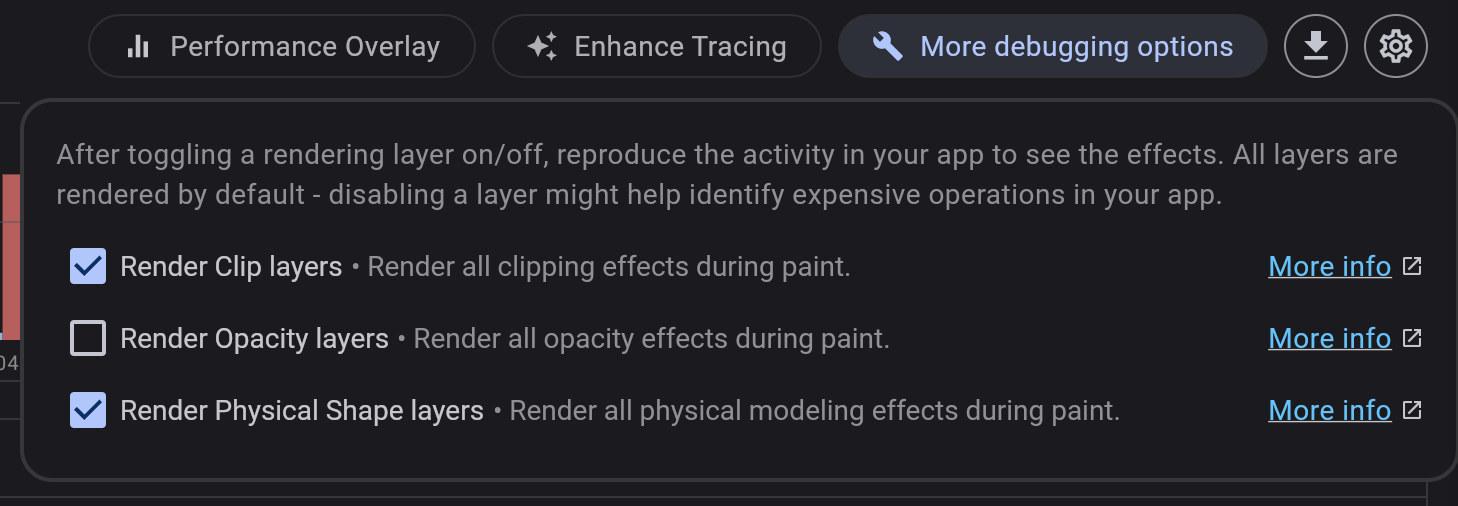
更多调试选项
想要诊断渲染图层相关的问题,请先关闭渲染层。下述的选项将会默认启动。
想要查看你的应用的性能影响,请尝试以相同的操作重现性能问题。在渲染层关闭的情况下,于构建帧图表里选择一个新的构建帧,查看它的时间线细节。如果 Raster 线程的时间消耗有显著降低,那么你禁用的效果的滥用可能是导致卡顿的主要原因。
渲染裁剪的图层
禁用该选项来检查已使用的裁剪图层是否影响了性能。如果禁用后性能有显著提升,请尝试减少你的应用中裁剪效果的使用。
渲染透明度图层
禁用该选项来检查已使用的透明度图层是否影响了性能。如果禁用后性能有显著提升,请尝试减少你的应用中透明度效果的使用。
渲染物理形状图层
禁用该选项来检查已使用的物理形状图层是否影响了性能,例如阴影和背景特效。如果禁用后性能有显著提升,请尝试减少你的应用中物理效果的使用。
导入导出
DevTools 支持导入和导出时间线快照。单击 export 按钮 (帧渲染图表右上角) 下载当前时间线的快照。要导入时间线快照,可以从任何页面拖放快照到 DevTools。提示:DevTools 仅支持导入 DevTools 导出的源文件。
其他资源
想要学习如何使用 DevTools 监控应用的性能和检测卡顿,可以阅读 性能视图教程。